
If you’re not a fan of Google Analytics, it means you haven’t experienced its full potential yet.
It’s like driving your car in first gear only – there’s so much more you can get out of it!
To make sure you truly realize what this tool can do for you, we’ve prepared this guide about the seven essential types of reports in Google Analytics you can create to learn more about your performance and whether your efforts are paying off.
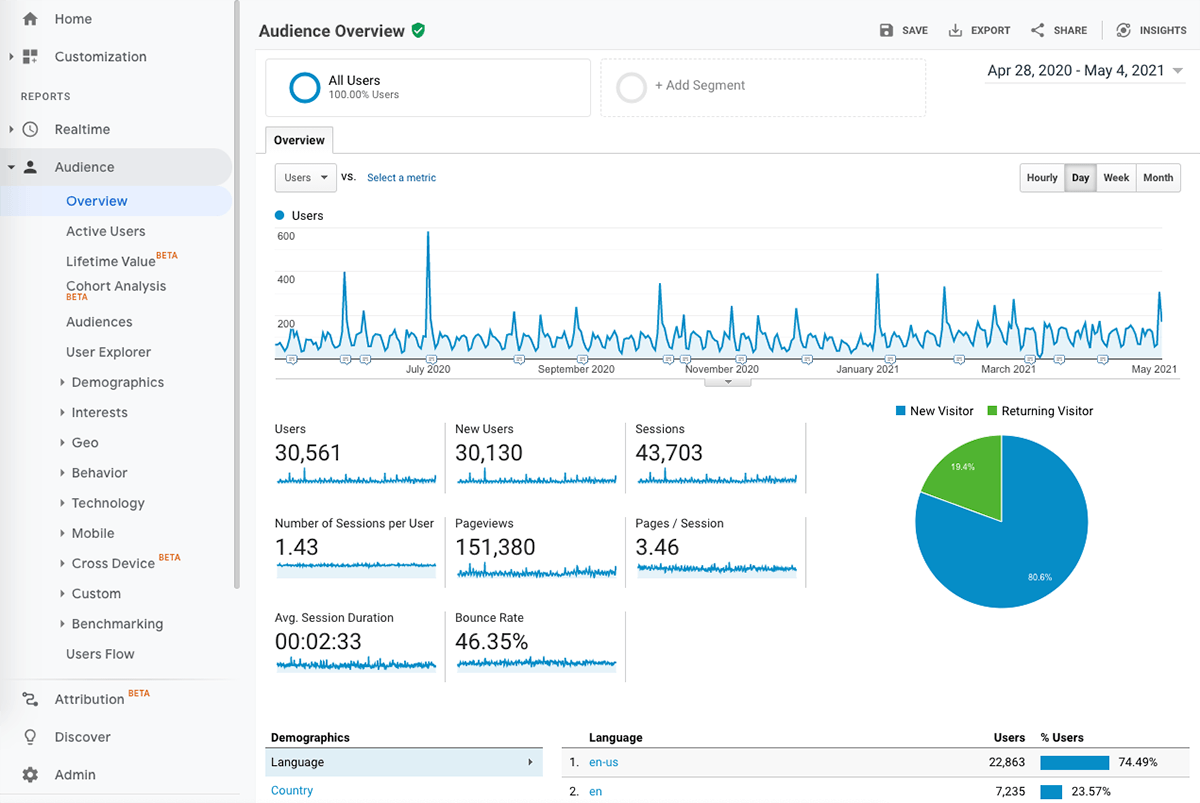
1. Audience Report
An audience report lets you learn a lot about your website visitors. Are they new users or are they returning to your site? Are they visiting it on their mobile devices or desktop computers? What are their characteristics, such as gender or age?
In your audience report, you can track active users, the lifetime value of your users, or perform cohort analysis – analysis of different groups of users with common characteristics.
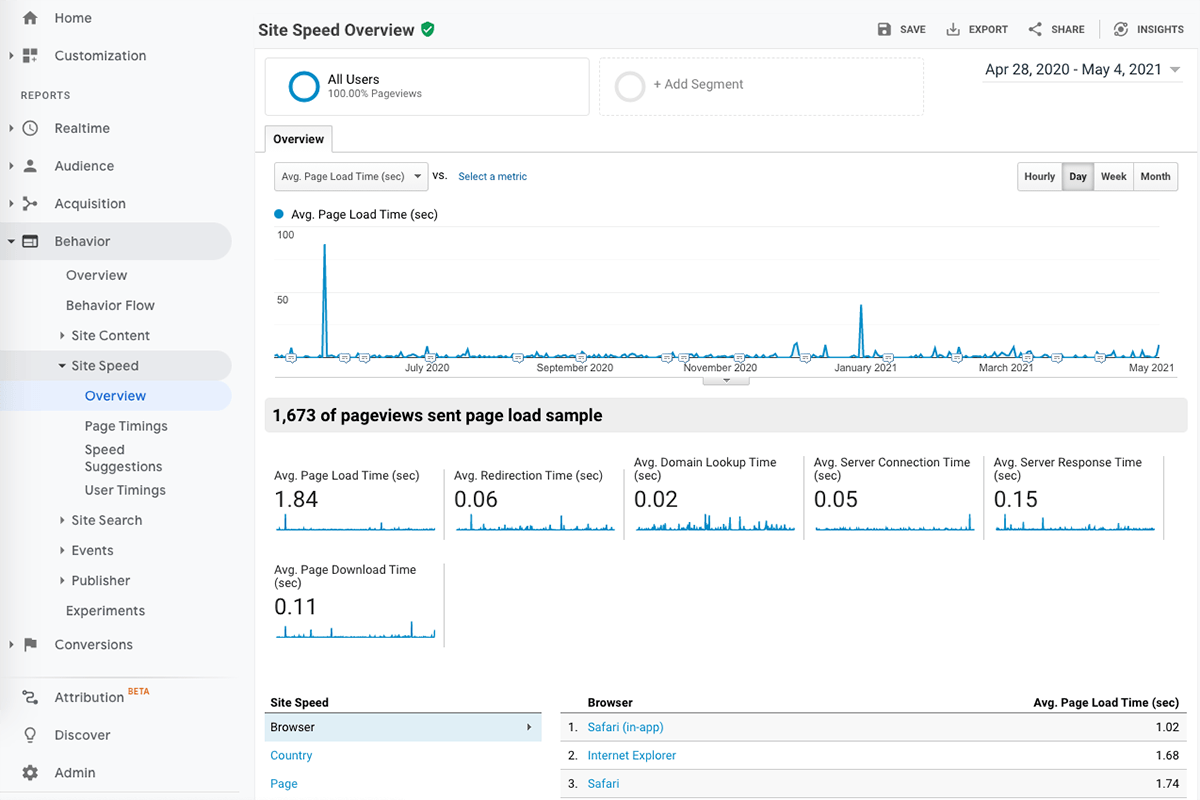
2. Site Speed Report
If your pages don’t load within three seconds, you may lose a huge percentage of your website visitors. That’s why it’s critical to always be up-to-date when it comes to your site speed. Thanks to this report, you can monitor all your website pages and identify lags as soon as they appear.
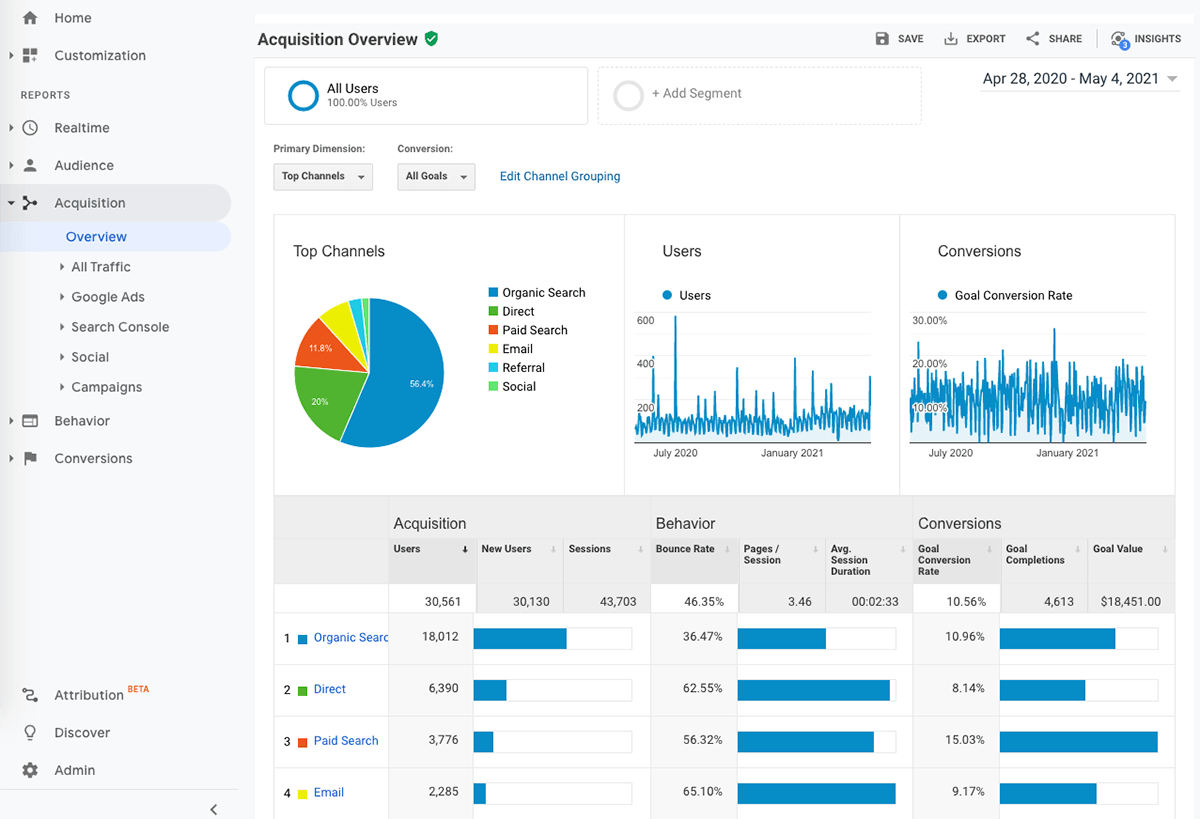
3. Analytics Acquisition Reports
Do you know where your visitors come from? You can learn that from the Acquisition report. When you know whether your users originate from your social media channels, organically through search engines, or referrals, you’ll know where to invest more effort in the future. Your traffic may also come to your site directly, without a referral, or via paid ads. Google Analytics categorizes your traffic so you can easily identify your top-performing traffic sources.
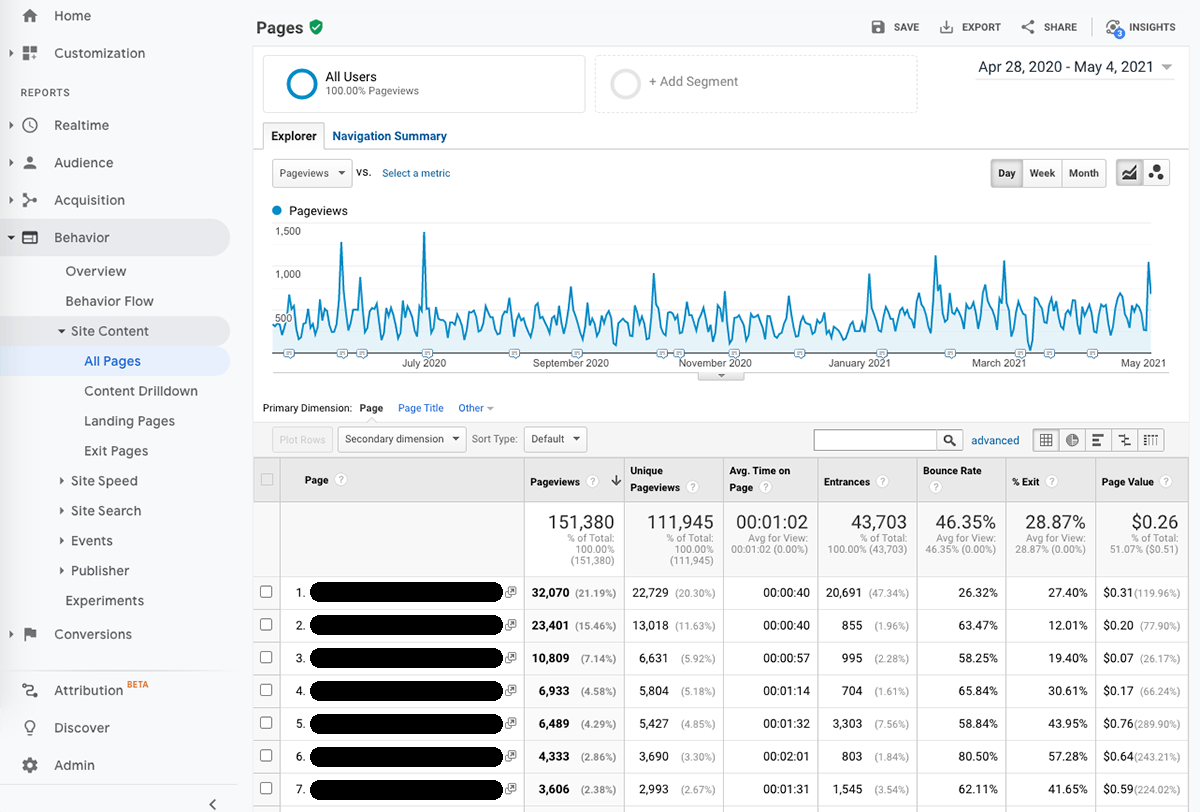
4. Content Report
By using the Content report, you can learn what pages on your website have performed the best over a specific period of time or for a particular audience segment. Moreover, the Landing Page report gives you insight into how successful your landing pages are in converting visitors, or what page your visitors were on when they left the site. This report helps you improve your content and make necessary tweaks in the customer journey to ensure longer sessions or more conversions.
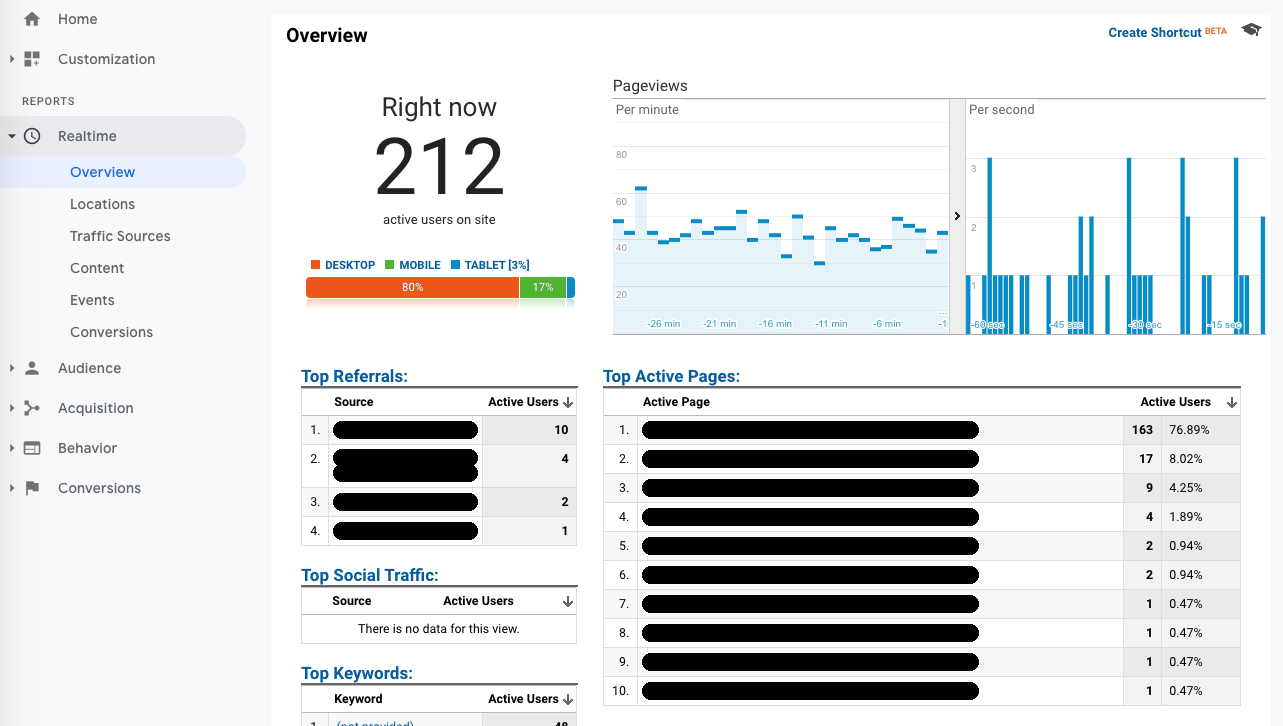
5. Real-Time Report
When you make a change on your website or run an ad on social media, you may want to know immediately how your audience is reacting to it.
The Real-time report lets you do just that – monitor what’s going on on your website at the very moment it’s happening.
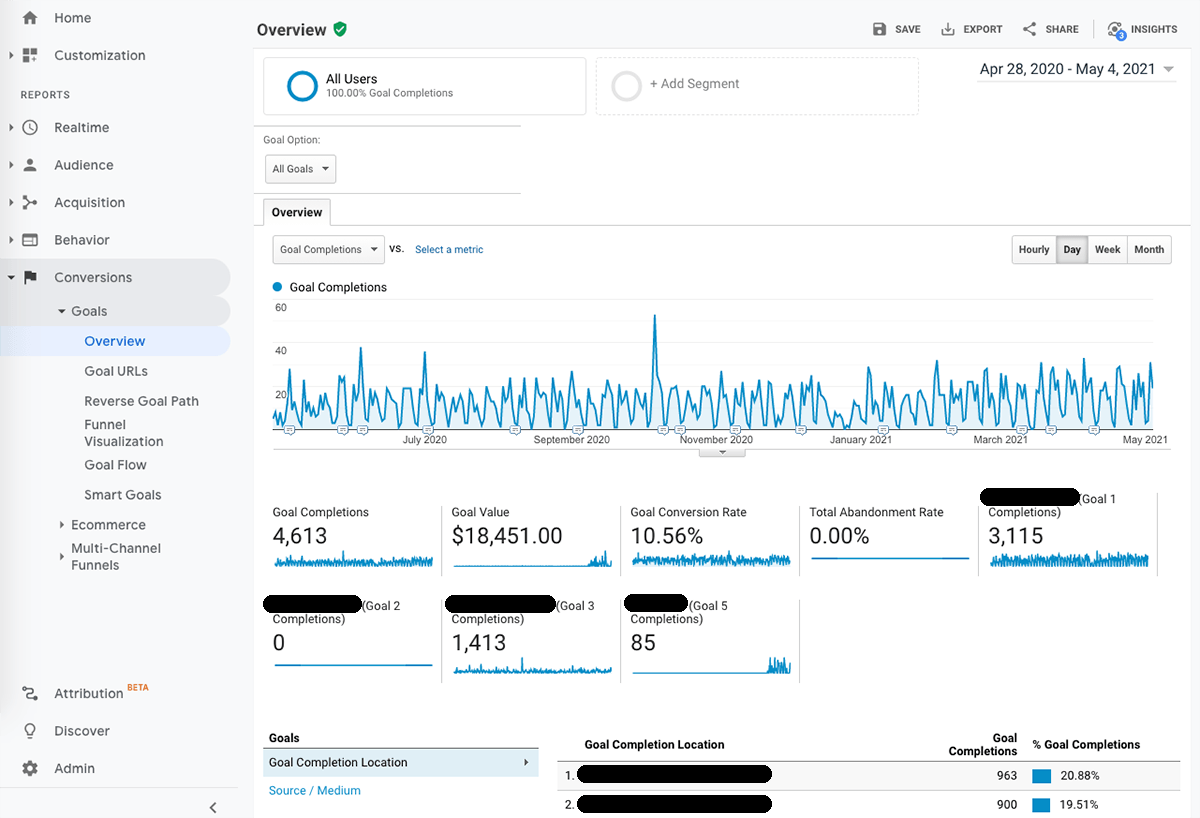
6. Conversion Reports
The Conversion report tells you how successful your website is in terms of leads and sales. If you’ve set goals, you can check the report to see if you’ve met them. For e-commerce websites, you can monitor your checkout flow and get a summary of your product inventory sales. Before you start examining your Conversion reports, define your goals. Are you aiming at a specific session duration, your user reaching a specific page, or something else?
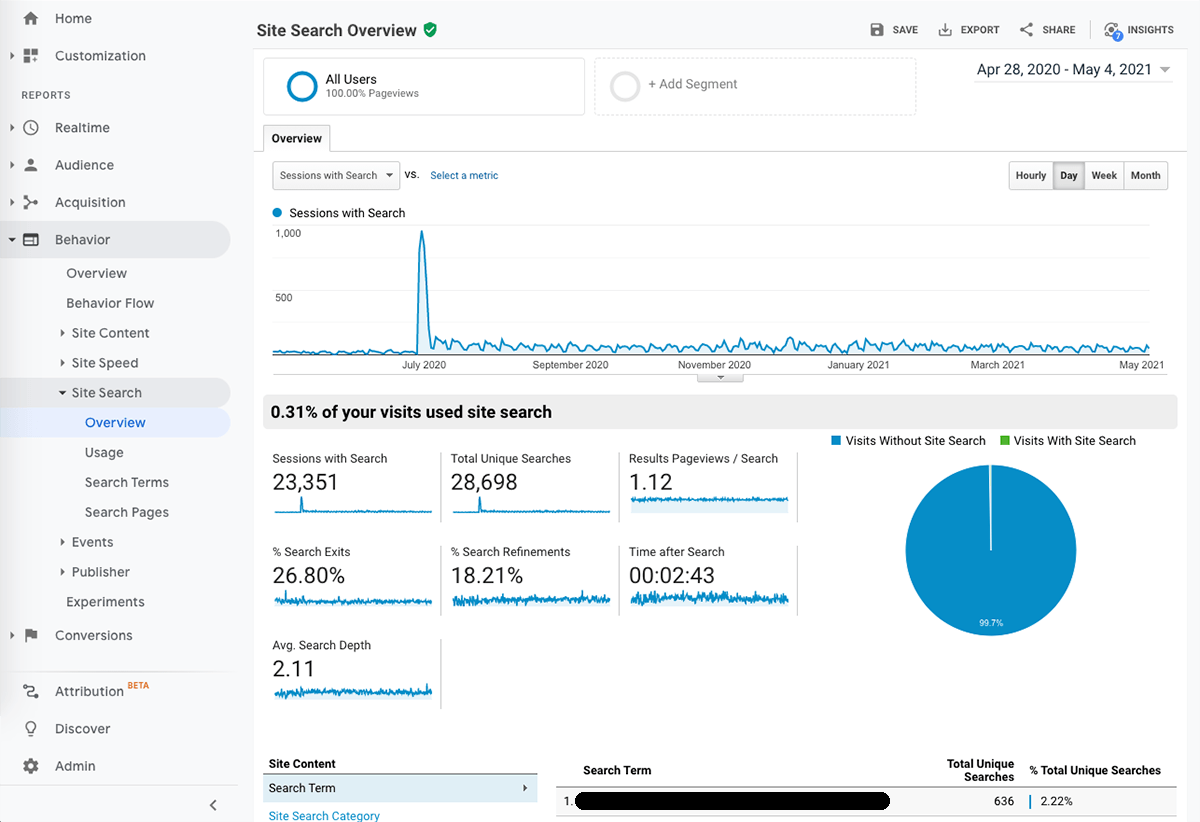
7. Site Search
What’s a good website without the search field? And the best thing about it is that the Site Search report can tell you just how much your users appreciate it. These analytics will tell you what your website visitors are searching, and how frequently they use the field. You’ll also gain insight into how many sessions happen with the user using the search field and without it happening, as well as where your users start searching for specific terms.
Are You Ready to Boost Your Performance?
Imagine what you can do when you take a deep dive into all the functionalities Google Analytics offers.
But, for starters, review these seven reports and find out all you can about your users and their activity on your website. After analyzing the data you extract from there, you’ll instantly get a bunch of ideas on how to improve your website performance.